Interactive Controls
Learn how to interact with SpatialVista visualizations in Jupyter.
Navigation
3D/2D View Controls
- Rotate: Drag or Shift + ↑↓←→
- Pan: Shift + Drag or ↑↓←→
- Zoom: Mouse wheel scroll
Annotation Panel
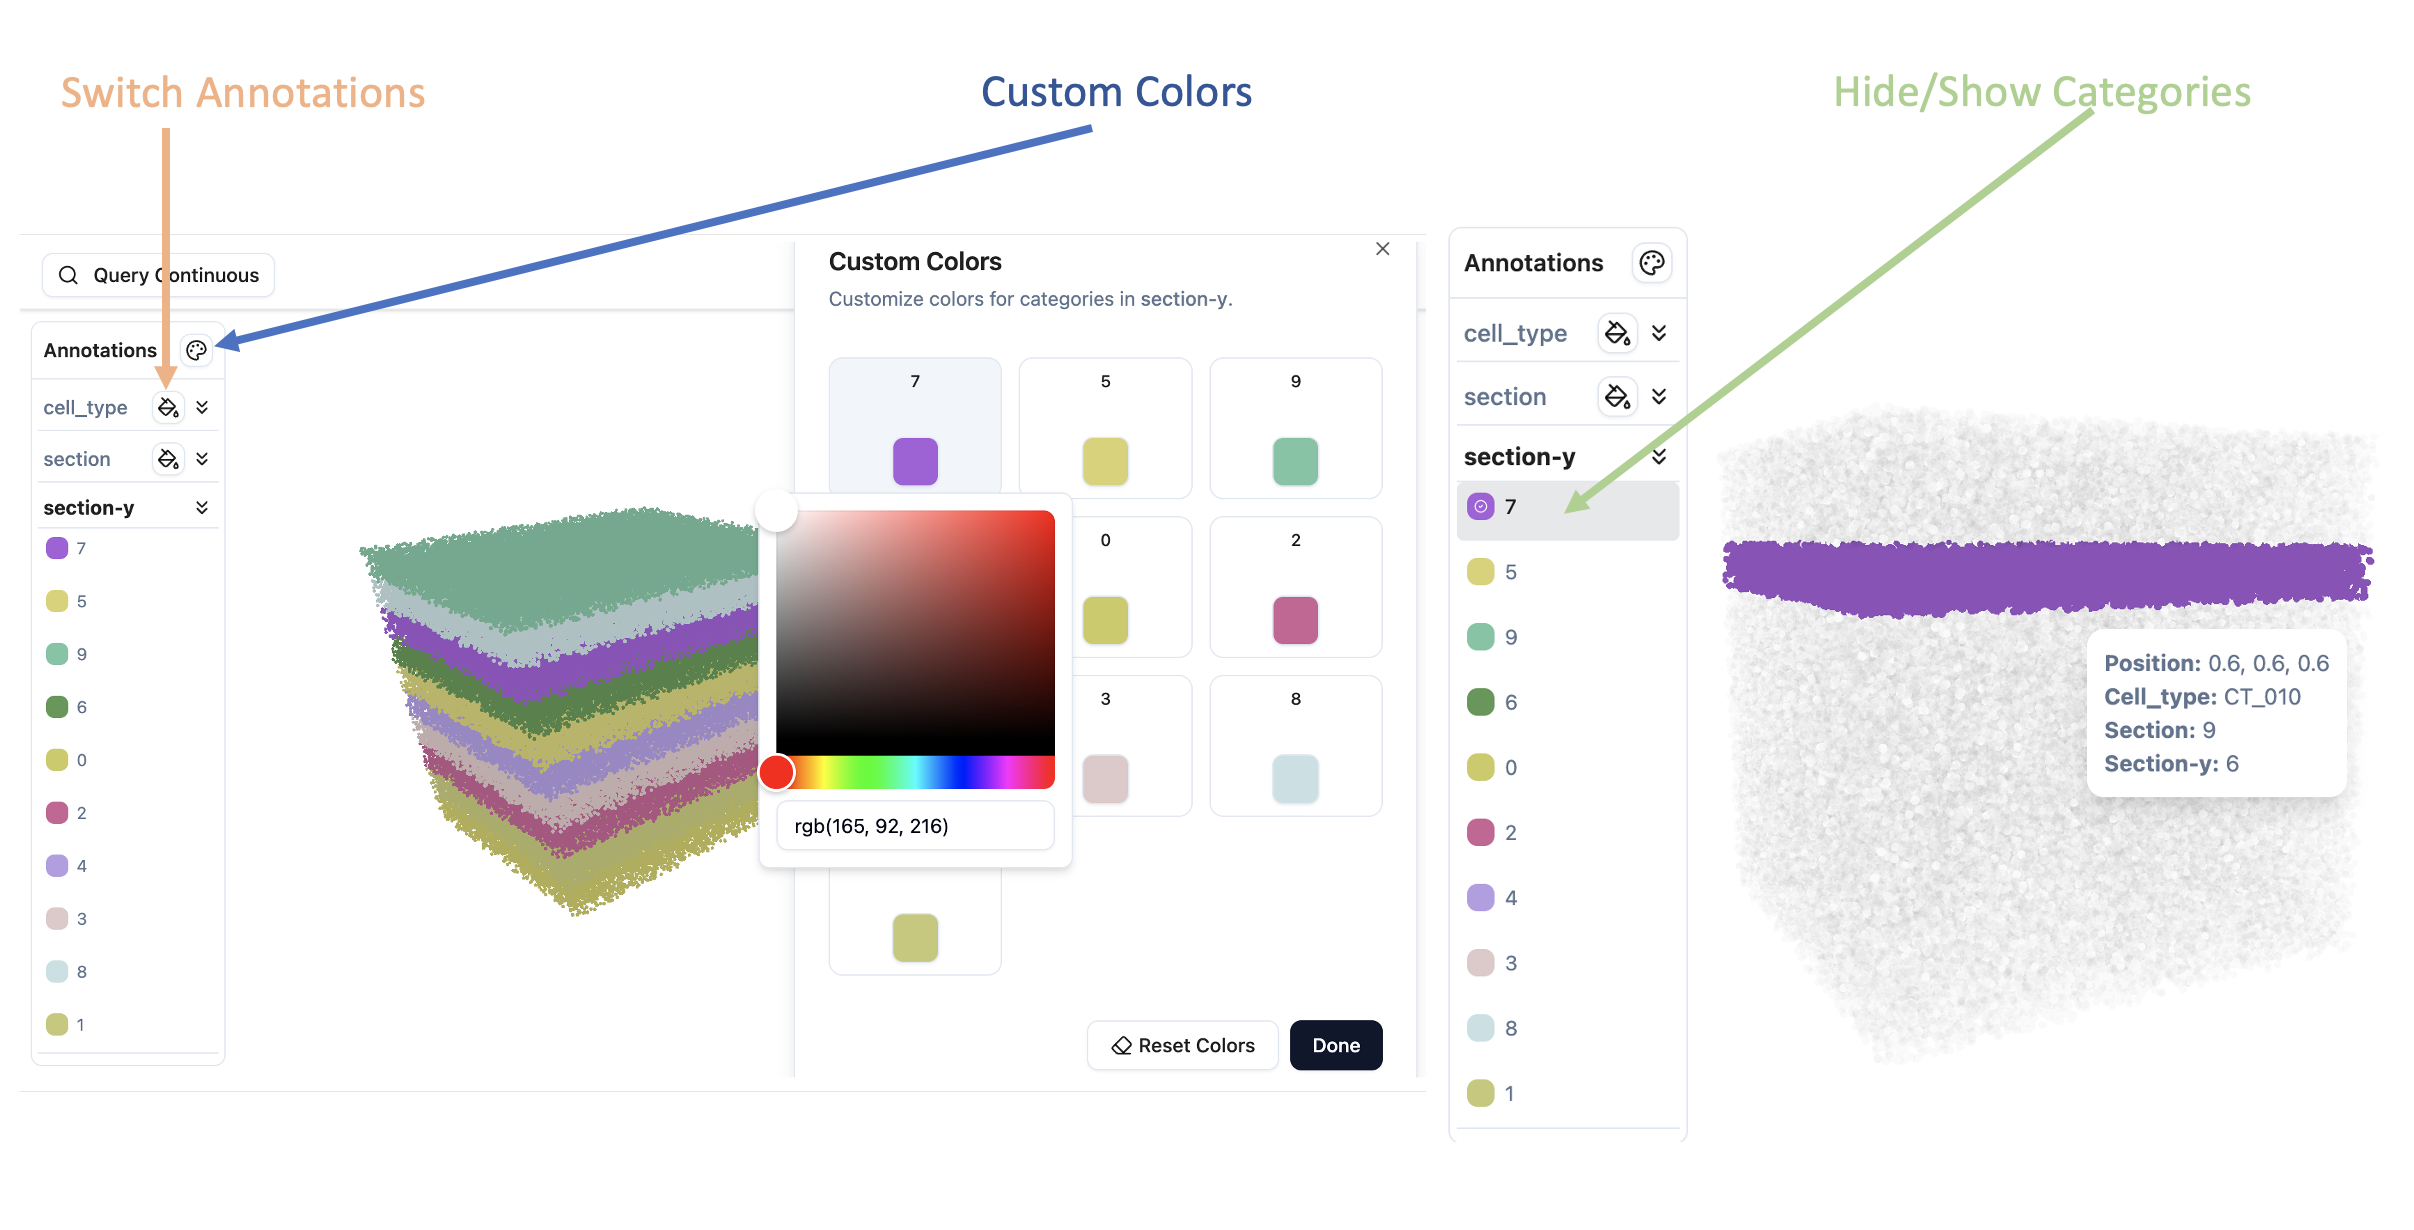
The left sidebar allows you to switch between different categorical annotations.
Features
- Switch Annotations: Click on different annotation types to change the coloring
- Hide/Show Categories: Click on category names in the legend to toggle visibility
- Custom Colors: Click on color swatches to open the color picker and change category colors
Control Panel
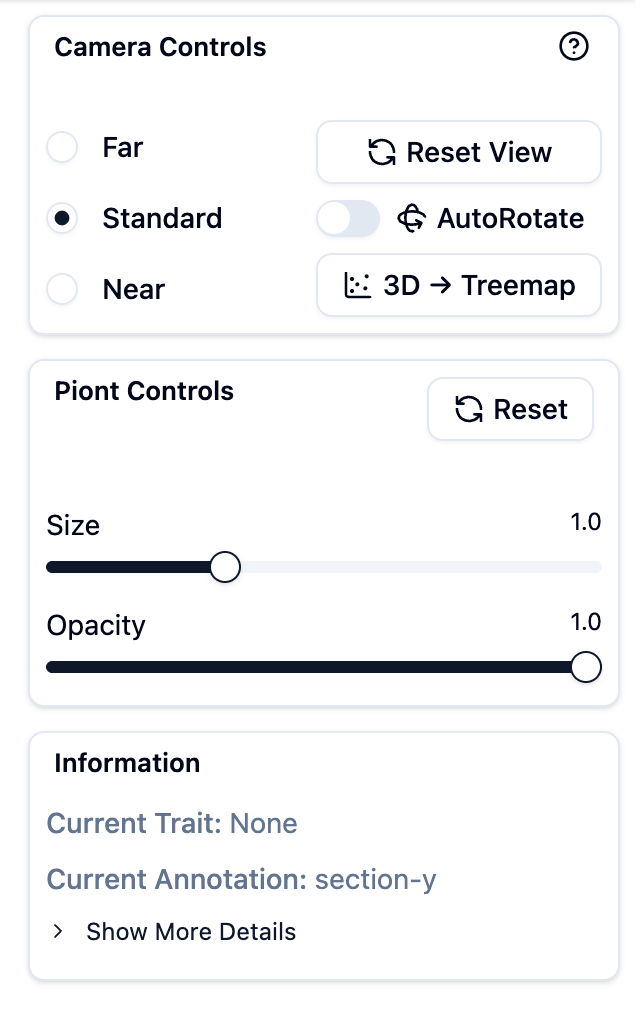
The right panel provides controls for adjusting visualization parameters.
Point Size
Adjust the size of individual points in the visualization.
- Use the slider to increase or decrease point size
- Useful for sparse or dense datasets
Point Opacity
Control the transparency of points.
- Lower values: More transparent (better for seeing overlapping structures)
- Higher values: More opaque (better for sparse data)
Slice Spacing
For 3D datasets loaded with a section key, use Slice spacing in Point Controls to adjust stacked slices along the Z axis:
- Multiplier scales the original distance between section centers.
1.0×keeps the original spacing,0×aligns the centers, and values up to10.0×expand the stack. - Fixed distance assigns a uniform numeric Z distance between adjacent section centers, such as
100, regardless of their original spacing.
The controls are available only in the 3D point-cloud view. Both modes preserve Z variation within each slice.
Section Alignment
For datasets with section information, the Section Alignment panel supports per-slice XY translation, rotation, uniform scaling, and X/Y flipping:
- Choose a fixed Reference section.
- Choose the Active section to transform.
- Choose Hybrid, Outline only, or Annotation only.
- For modes that use annotations, select a field such as
organorcelltype. Hybrid mode also lets you balance outline and annotation evidence. - Click Auto align, then fine-tune the numeric controls while viewing the result.
Numeric inputs apply only when Enter is pressed. The compact XY pad, rotation dial, and sliders update the point cloud immediately during mouse or touch movement. Flip buttons also apply immediately. Hover over the question-mark button in the panel header for a compact interaction guide.
Annotation only matches the centers of shared categories. Outline only rasterizes each slice to a small occupancy grid, extracts at most 320 boundary representatives, and minimizes a symmetric Chamfer distance between the two boundaries. Hybrid combines normalized outline and annotation errors using the selected weight. All modes evaluate unflipped, X-flipped, Y-flipped, and XY-flipped candidates. Outline-based modes perform a coarse rotation search followed by two local refinement passes.
Automatic scaling is disabled by default because sparse landmarks or genuinely different adjacent tissue outlines can produce misleading scale estimates. When explicitly enabled, the estimated scale is clamped to 0.5–2×. Use Export alignment JSON to save the auto-alignment settings, transforms, flips, and Z-spacing settings.
Two batch workflows are available. First → all keeps the first section as the reference and aligns every later section to it. S1 → S2 → … aligns the second section to the first, then uses the aligned second section as the reference for the third, continuing through the stack. Starting either workflow replaces the current per-section transforms with the new workflow result.
In Jupyter, the same parameters are synchronized to the widget:
The second command writes aligned three-dimensional coordinates to adata.obsm["spatial_aligned"].
Layout Modes
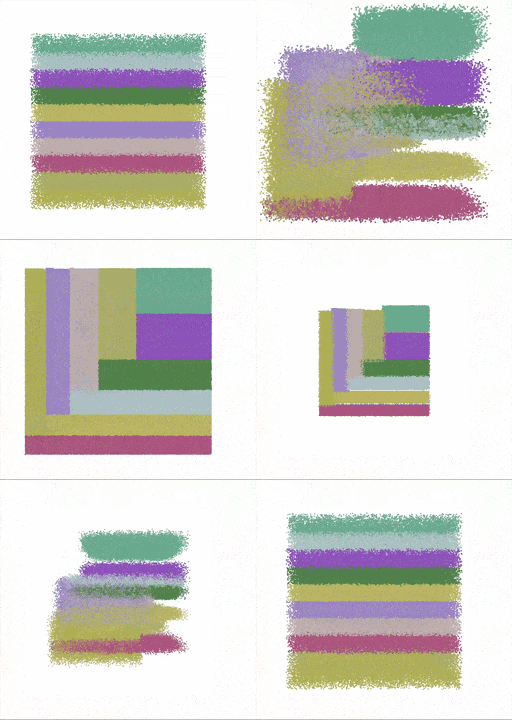
Switch between different spatial arrangements:
- Original: Display points at their original coordinates
- 2D Treemap: Arrange points in a space-filling treemap layout
- 2D Histogram: Arrange points in histogram bins
Continuous Values & Gene Expression
Selecting Variables
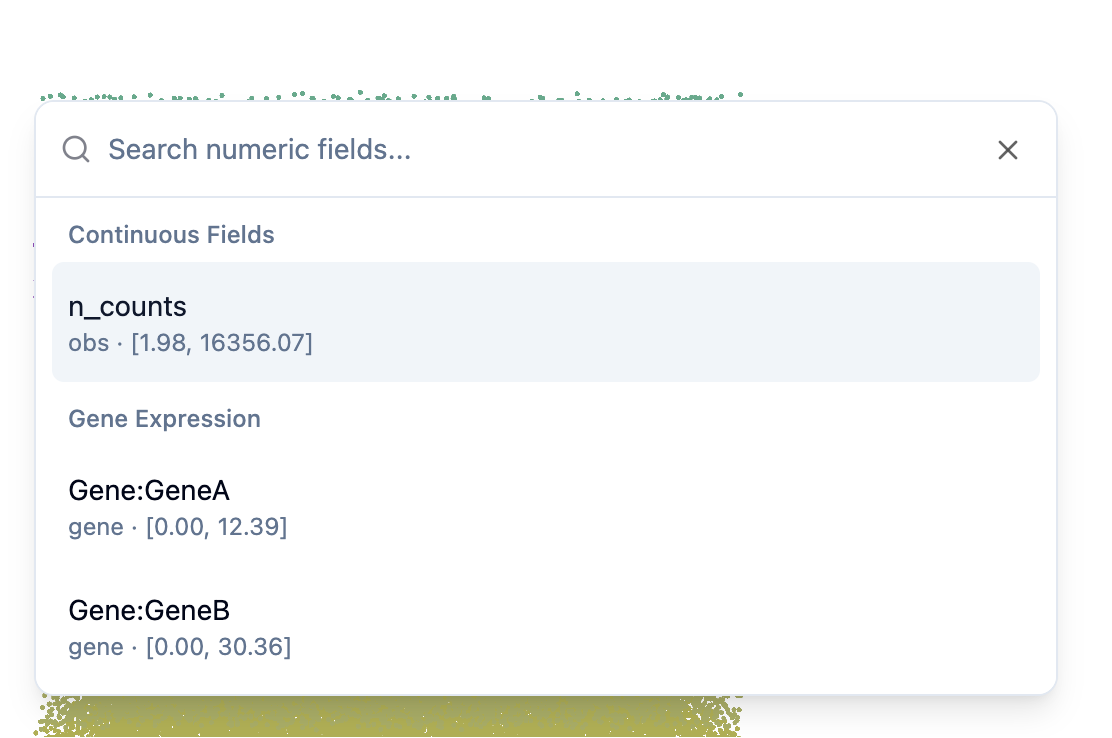
Use the dropdown menu to select continuous values or gene expression:
- Continuous observations: QC metrics, cell scores, etc.
- Gene expression: Any gene from your dataset
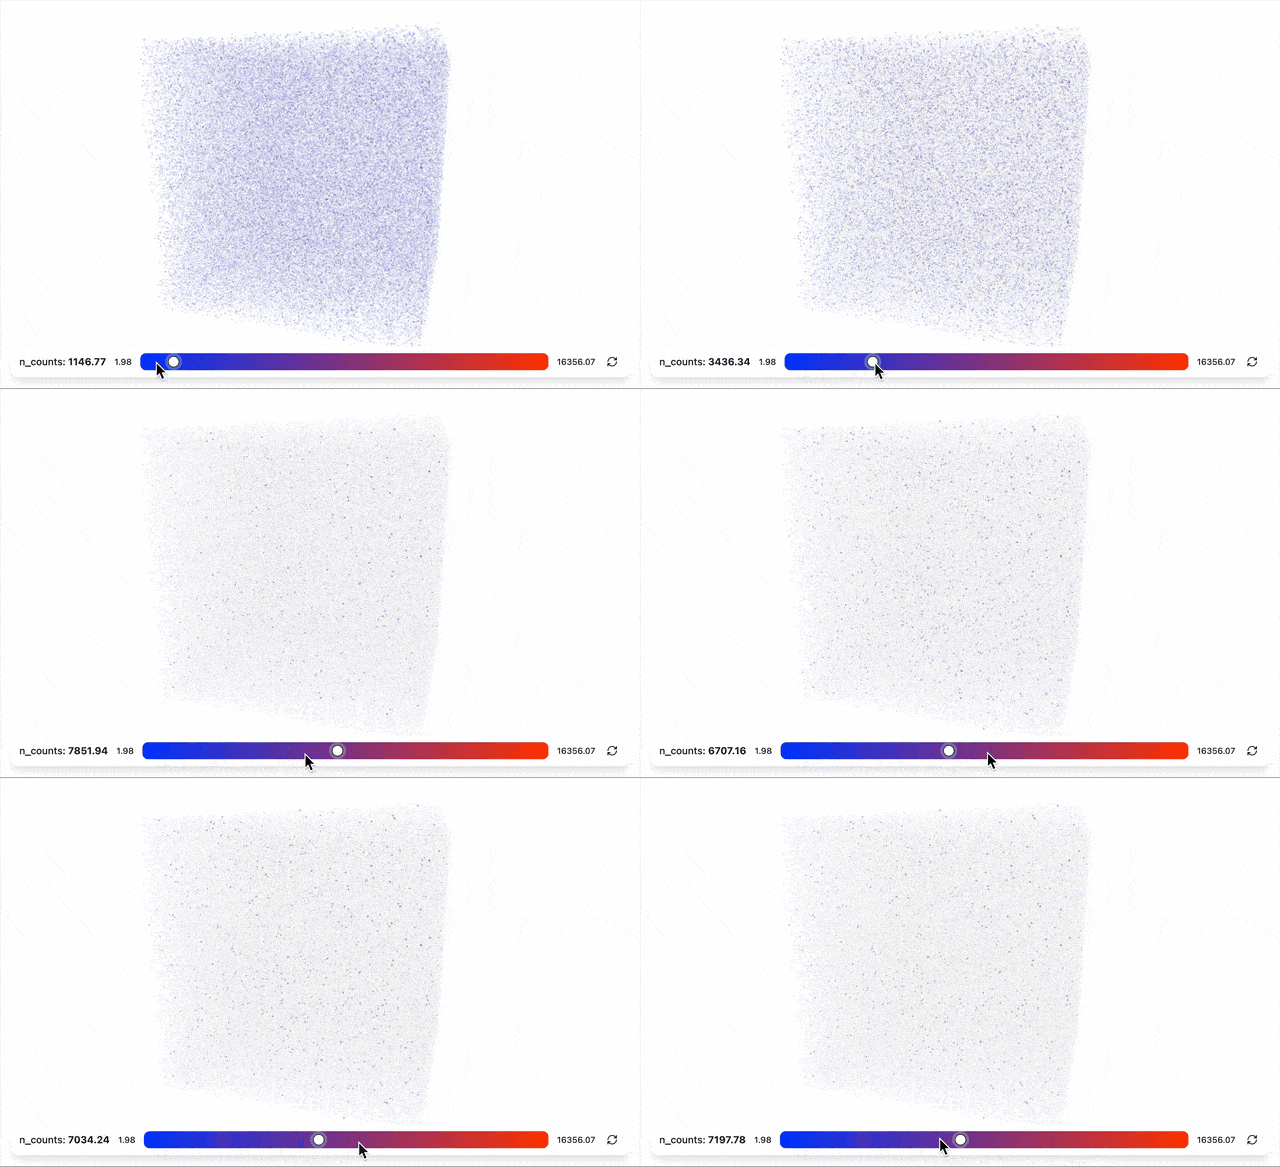
Threshold Slider
When a continuous value or gene is selected, a slider appears at the bottom:
- Adjust threshold: Move the slider to filter points by value
- Color gradient: The background shows the value range
- Reset: Click the reset button to return to minimum value
View Switching
2D/3D Toggle
If your data has section information, you can switch between views:
- 3D View: Full 3D point cloud
- 2D View: Section-by-section 2D slices
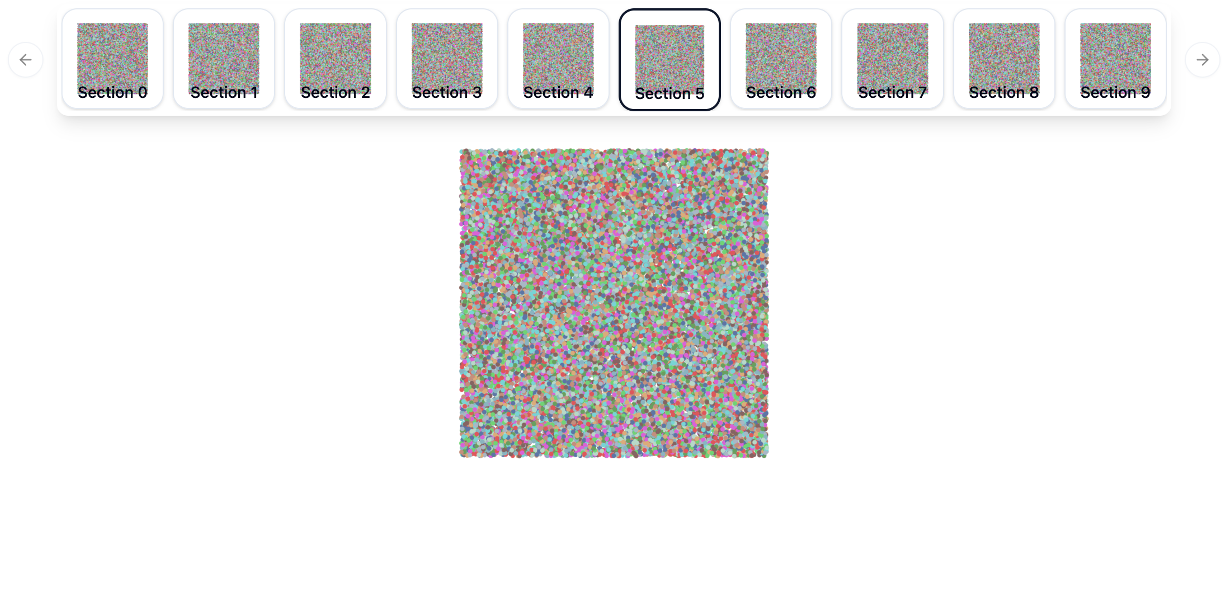
Section Carousel
In 2D mode, use the section carousel to browse different slices:
- Click thumbnails: Jump to a specific section
- Preview: Each thumbnail shows a preview of that section
Screenshots
Capture Current View
Click the camera icon in the header to save the current visualization:
- Captures exactly what you see on screen
- Downloads as PNG image
- Includes current colors, filters, and layout
Next: Check the API Reference for programmatic control options.