SpatialVista - Interactive 3D Spatial Transcriptomics Visualization




Overview
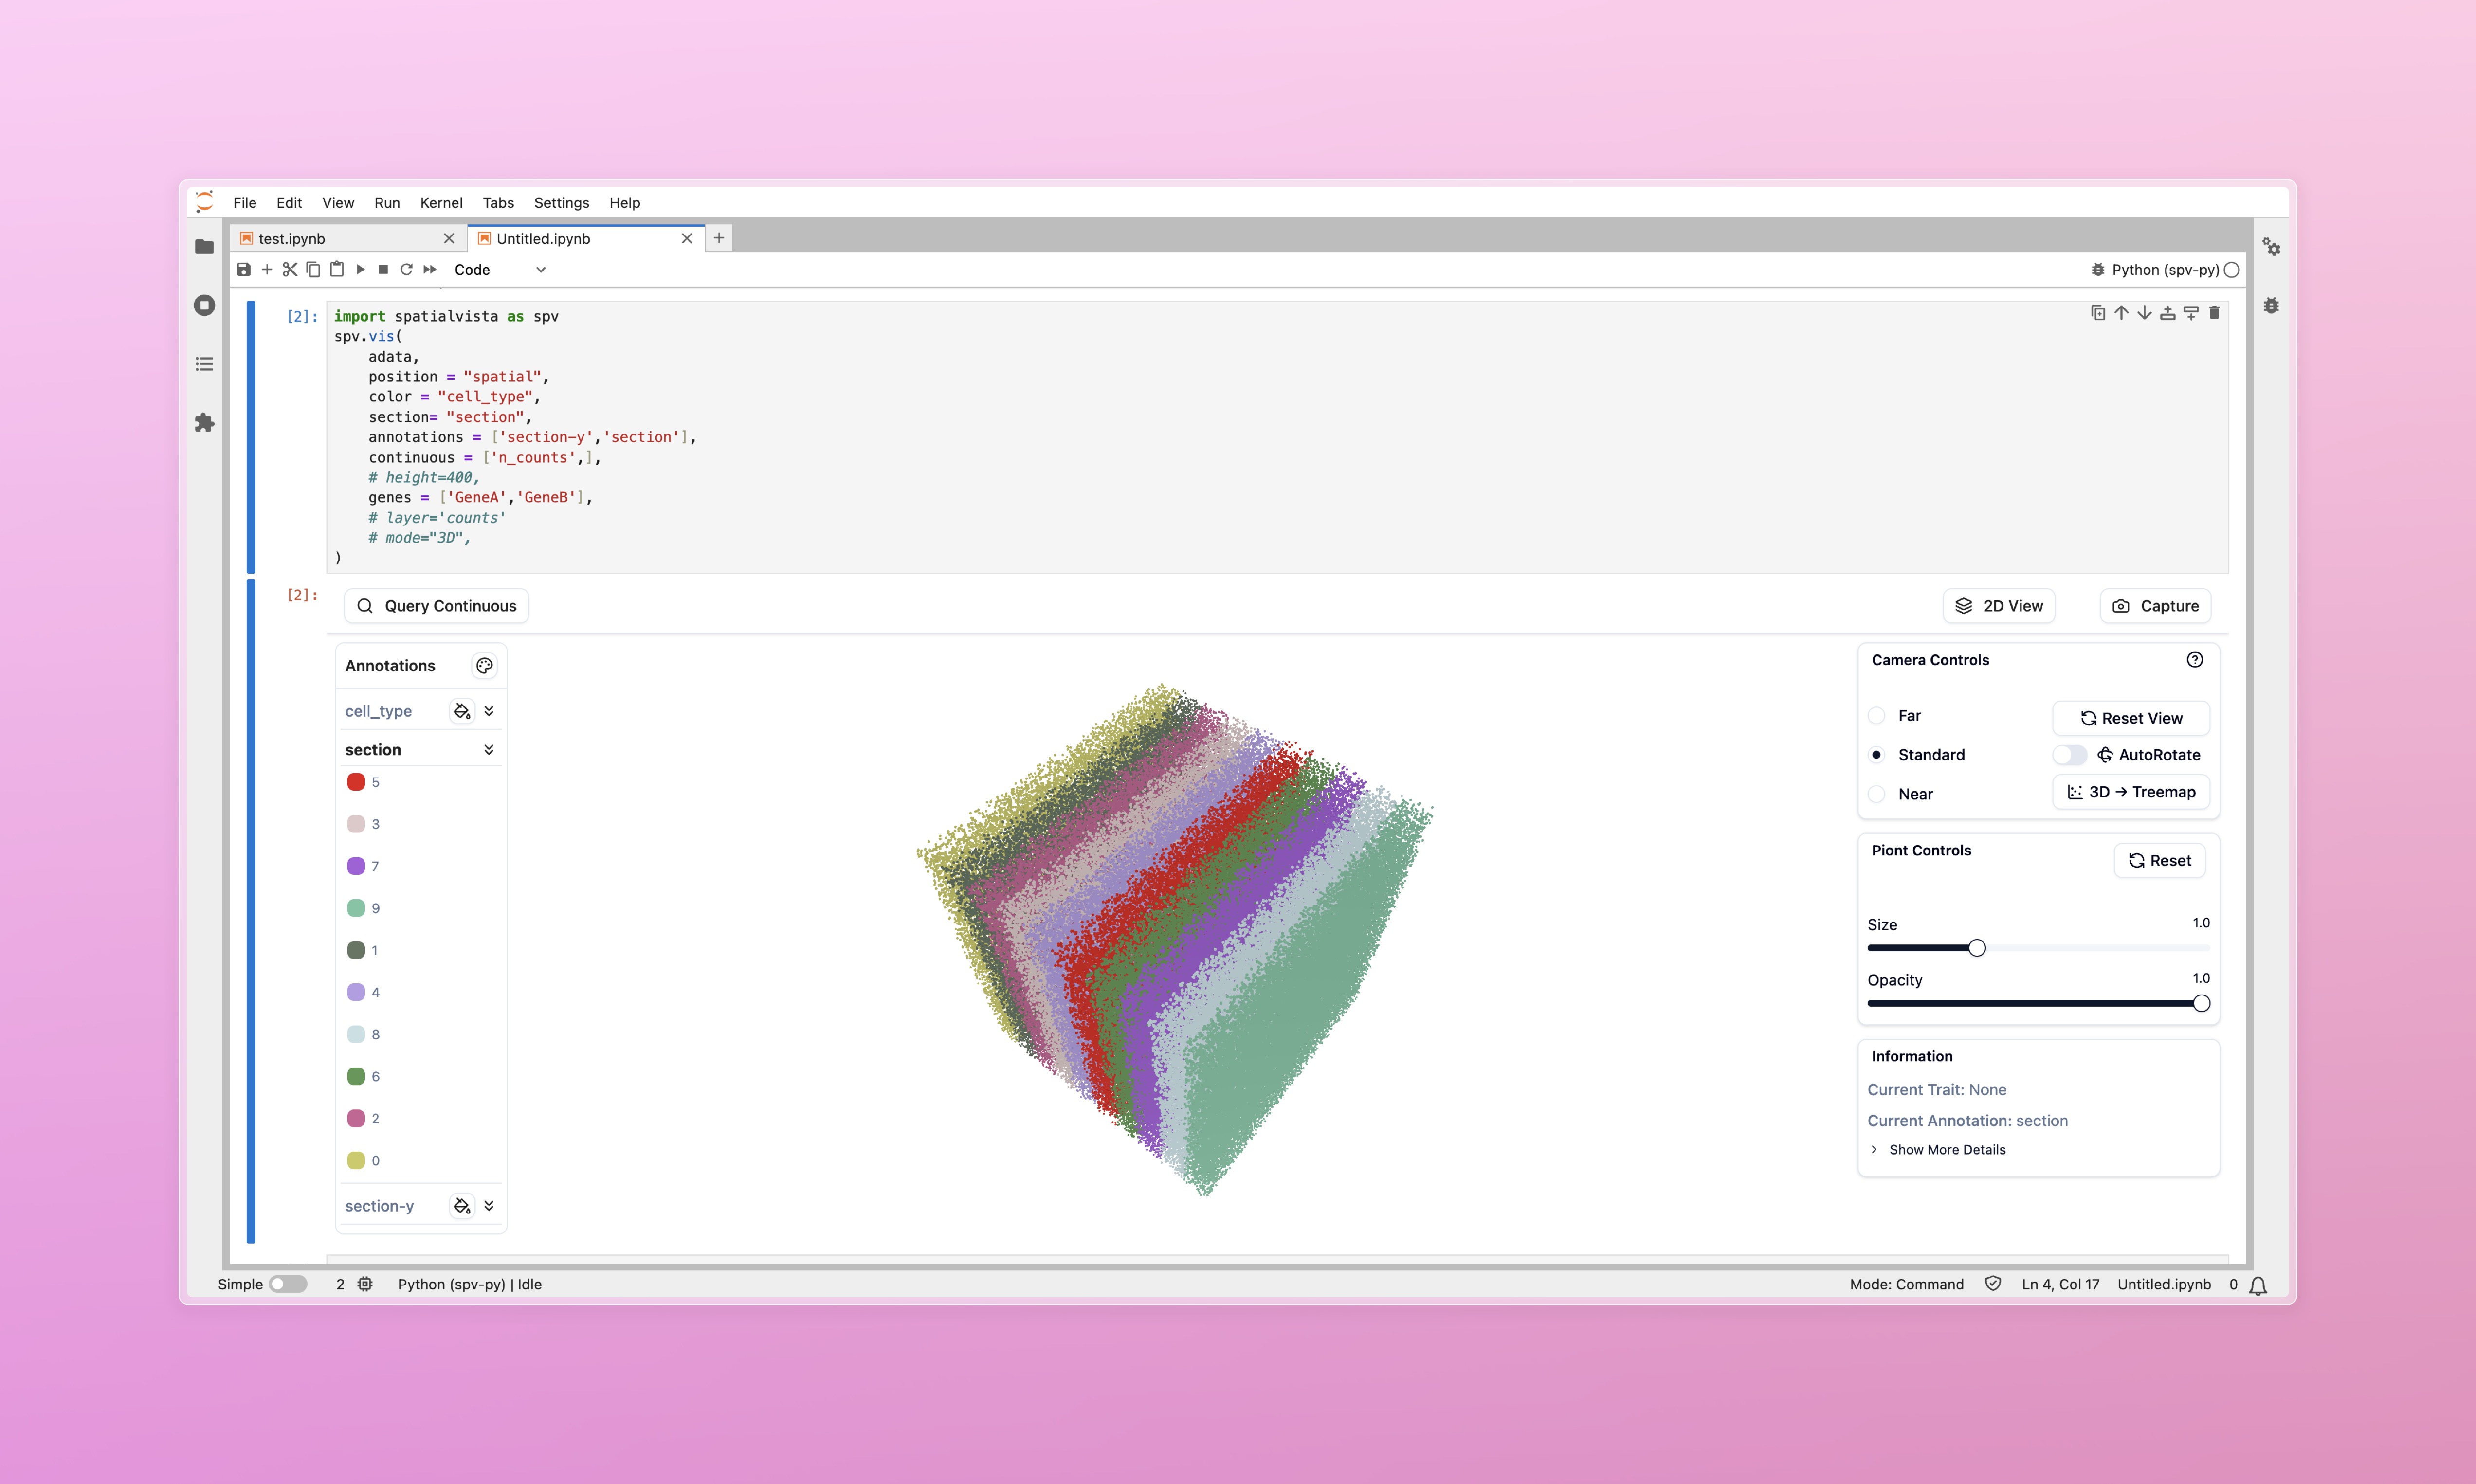
SpatialVista is an interactive 3D spatial transcriptomics visualization tool designed specifically for Jupyter Notebook/Lab. It seamlessly integrates into your data analysis workflow, providing efficient and intuitive exploration of spatial omics data.
✨ Key Features
- 🚀 High-Performance Rendering - WebGL-based 3D rendering supporting millions of cells
- 📊 Multi-Dimensional Data Display - Support for categorical annotations, continuous values, gene expression, and more
- 🎨 Interactive Controls - Real-time adjustment of colors, transparency, point size, and other parameters
- 🔬 2D/3D View Switching - Flexible switching between 3D point cloud and 2D slice views
- 🧬 Gene Expression Query - Quick visualization of spatial expression patterns for any gene
- 📐 Multiple Layout Modes - Support for original coordinates, 2D Treemap, histogram, and more
- 🎯 Precise Filtering - Filter data points by category, numerical range, and other conditions
- 💾 One-Click Screenshots - Easily save current views for publications and reports
🎯 Use Cases
SpatialVista is particularly suitable for:
- Spatial Transcriptomics Data Exploration - Visium, MERFISH, seqFISH, STARmap, and other technologies
- Single-Cell Spatial Data Analysis - Visualize spatial distribution of cell types
- Tissue Architecture Studies - Explore molecular features of tissue regions
- Gene Expression Pattern Analysis - View spatial expression of specific genes
- Data Quality Control - Quickly check data integrity and outliers
🚀 Quick Start
Installation
Basic Usage
import spatialvista as spv
import scanpy as sc

# Load spatial transcriptomics data
adata = sc.read_h5ad("spatial_data.h5ad")

# Create interactive visualization
widget = spv.vis(
    adata,
    position="spatial",  # obsm key containing spatial coordinates
    color="celltype",    # Default annotation for coloring
    height=600               # Widget height in pixels
)

# Display widget
widget
That's it! 🎉
📚 Core Features
1. Categorical Annotation Visualization
# Color by cell type
widget = spv.vis(
    adata,
    position="spatial",
    color="celltype",
    annotations=["leiden", "tissue_region"]  # Additional annotations to load
)
2. Continuous Value Visualization
# Visualize continuous values (e.g., QC metrics)
widget = spv.vis(
    adata,
    position="spatial",
    color="celltype",
    continuous=["total_counts", "n_genes"]  # Continuous value fields
)
3. Gene Expression Visualization
# View expression patterns of specific genes
widget = spv.vis(
    adata,
    position="spatial",
    color="celltype",
    genes=["Pecam1", "Cd3e", "Epcam"],  # Gene list
    layer="normalized"  # Optional: use specific layer if available
)
4. 2D/3D View Switching
# If data has section information, switch to 2D view in UI
widget = spv.vis(
    adata,
    position="spatial",
    color="celltype",
    section="slice_id",  # Section identifier field for section browser
)
In the 3D point-cloud view, datasets with section information provide Slice spacing controls. Spacing can be adjusted as a multiplier of the original Z distances or as an exact uniform distance between adjacent section centers.
SpatialVista also supports interactive section alignment. Select reference and active slices, adjust translation, rotation, scale, and flips, or automatically align annotation landmarks, complete tissue outlines, or a weighted combination of both. Jupyter users can write the aligned coordinates back with widget.apply_alignment("spatial_aligned").
🎨 Interactive Controls
Once displayed, the widget provides rich interactive controls for exploring your data:
- Navigate in 3D space (rotate, pan, zoom)
- Switch between annotations and customize colors
- Query continuous values and gene expression
- Filter by thresholds and hide specific categories
- Adjust visualization parameters (size, opacity, layout)
- Export screenshots
→ Learn more about interactive controls
📖 Learn More
- Quick Start - Installation and minimal example
- Interactive Controls - Learn how to use the visualization
- API Reference - Complete function documentation
- FAQ - Troubleshooting and tips
🤝 Contributing & Support
Issues and Pull Requests are welcome!
- GitHub: https://github.com/yourusername/spatial-vista-py
- Documentation: https://spatial-vista-py.readthedocs.io
📄 License
SpatialVista is open-sourced under the MIT License.
Built with ❤️ for spatial omics research by WenjieWei@YangLab